Home
Machine Learning Algorithm
Data Visualization
Pandemic Resources
strea
ML
ined Pandemic Directory
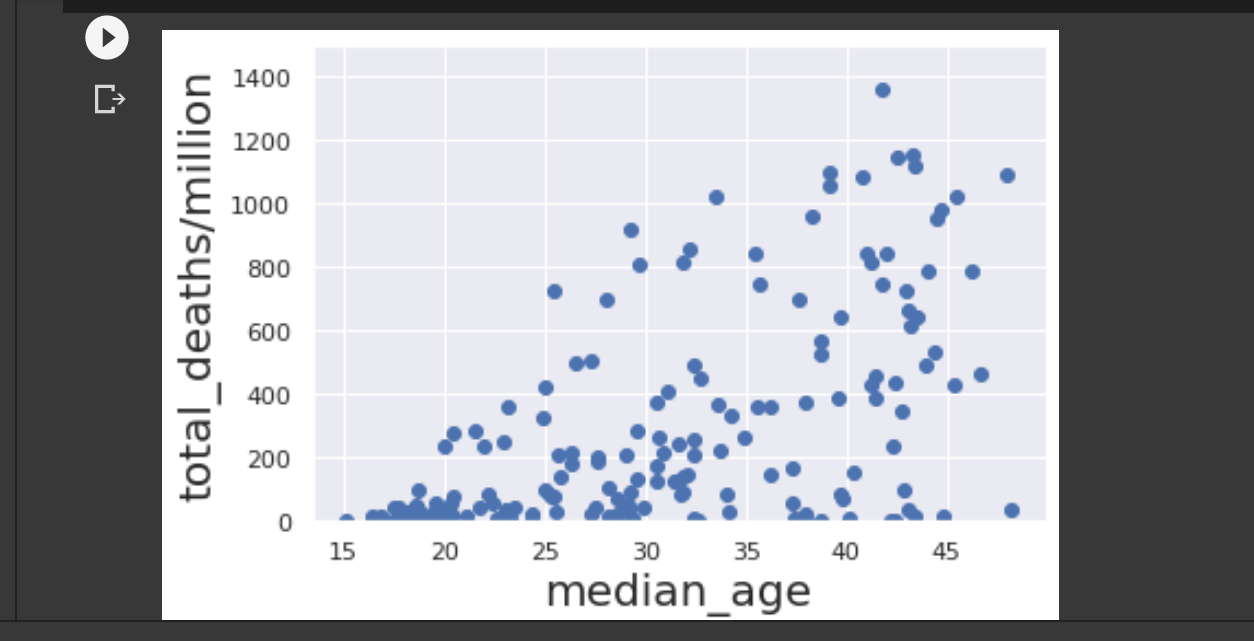
Data Visualization
The Data Visualizations were created from the predictions made by the Machine Learning Algorithm. The graphs include the output data from the algorithm, and they display pandemic-related variables based on various factors.
Scroll Down to View Graphs